
GoGuardian Admin was the very first product GoGuardian offered in 2014 and remains its flagship product. It helps k-12 school districts in the U.S. become compliant with the Children's Internet Protection Act by effectively filtering explicit content on school-issued devices.
Problem
School I.T. administrators across the country handle thousands of school-issued student devices on a daily basis. GoGuardian Admin allows them to manage those devices and make sure students aren't accessing explicit or violent content on the internet.
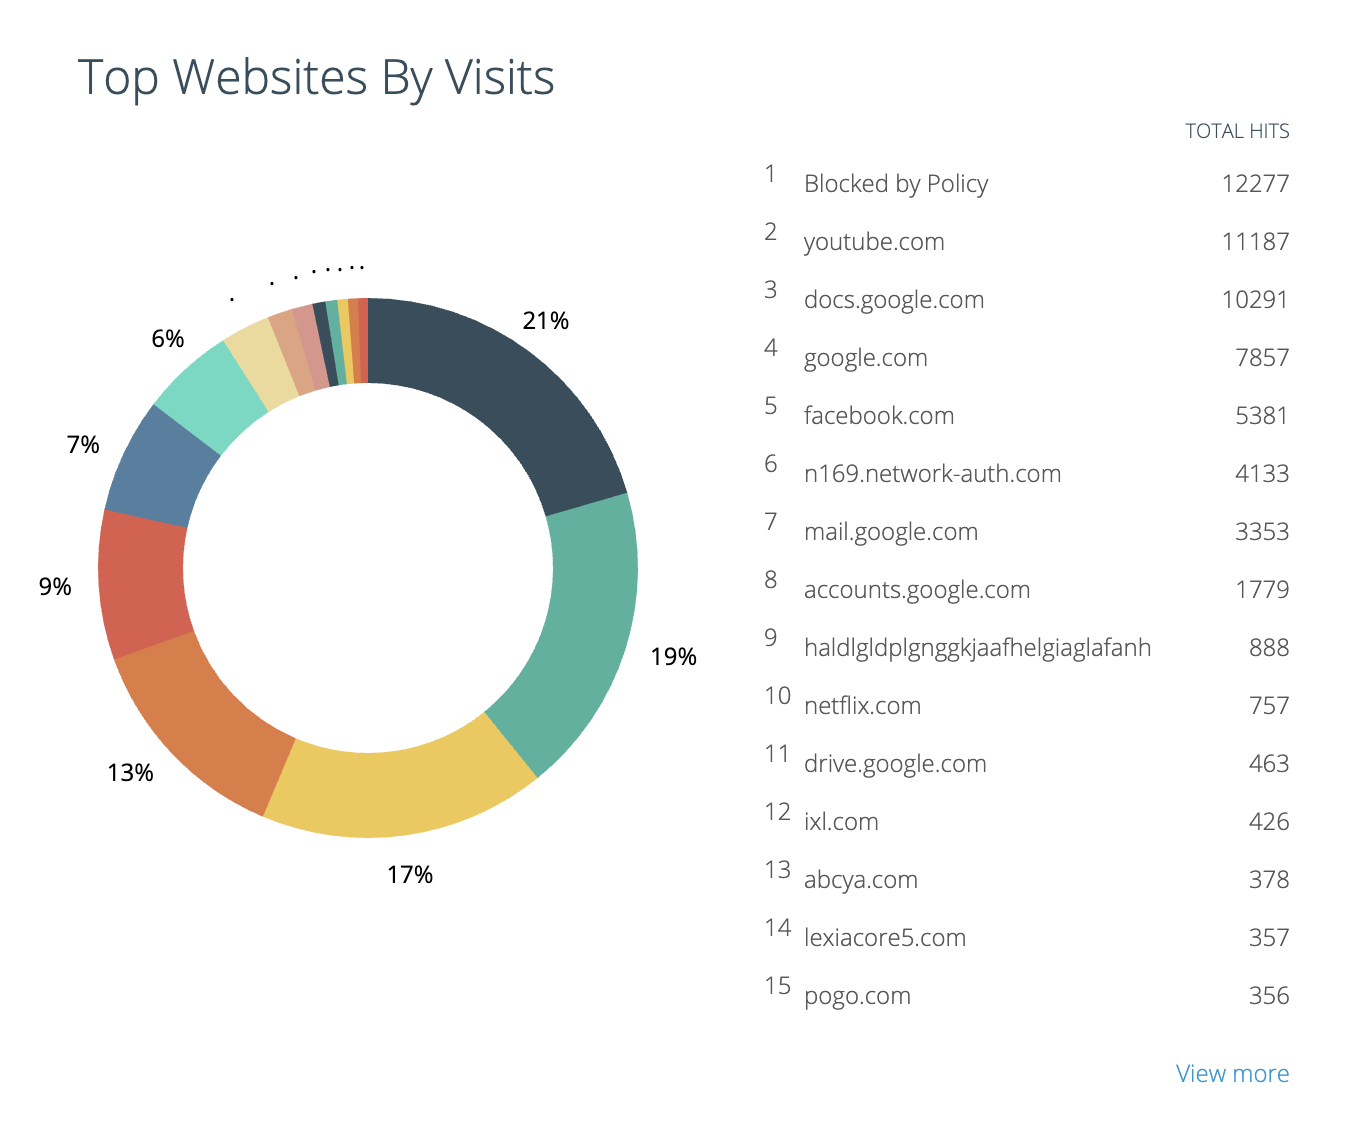
Our reporting often focused on showing lists of 'top' activity that didn't change much for weeks at a time due to the requirements of becoming 'top' content. It left our administrators working harder to troubleshoot both network and behavior issues.
Our Data Science team was also very upset about the use of a pie chart for this visualization.
Strategy
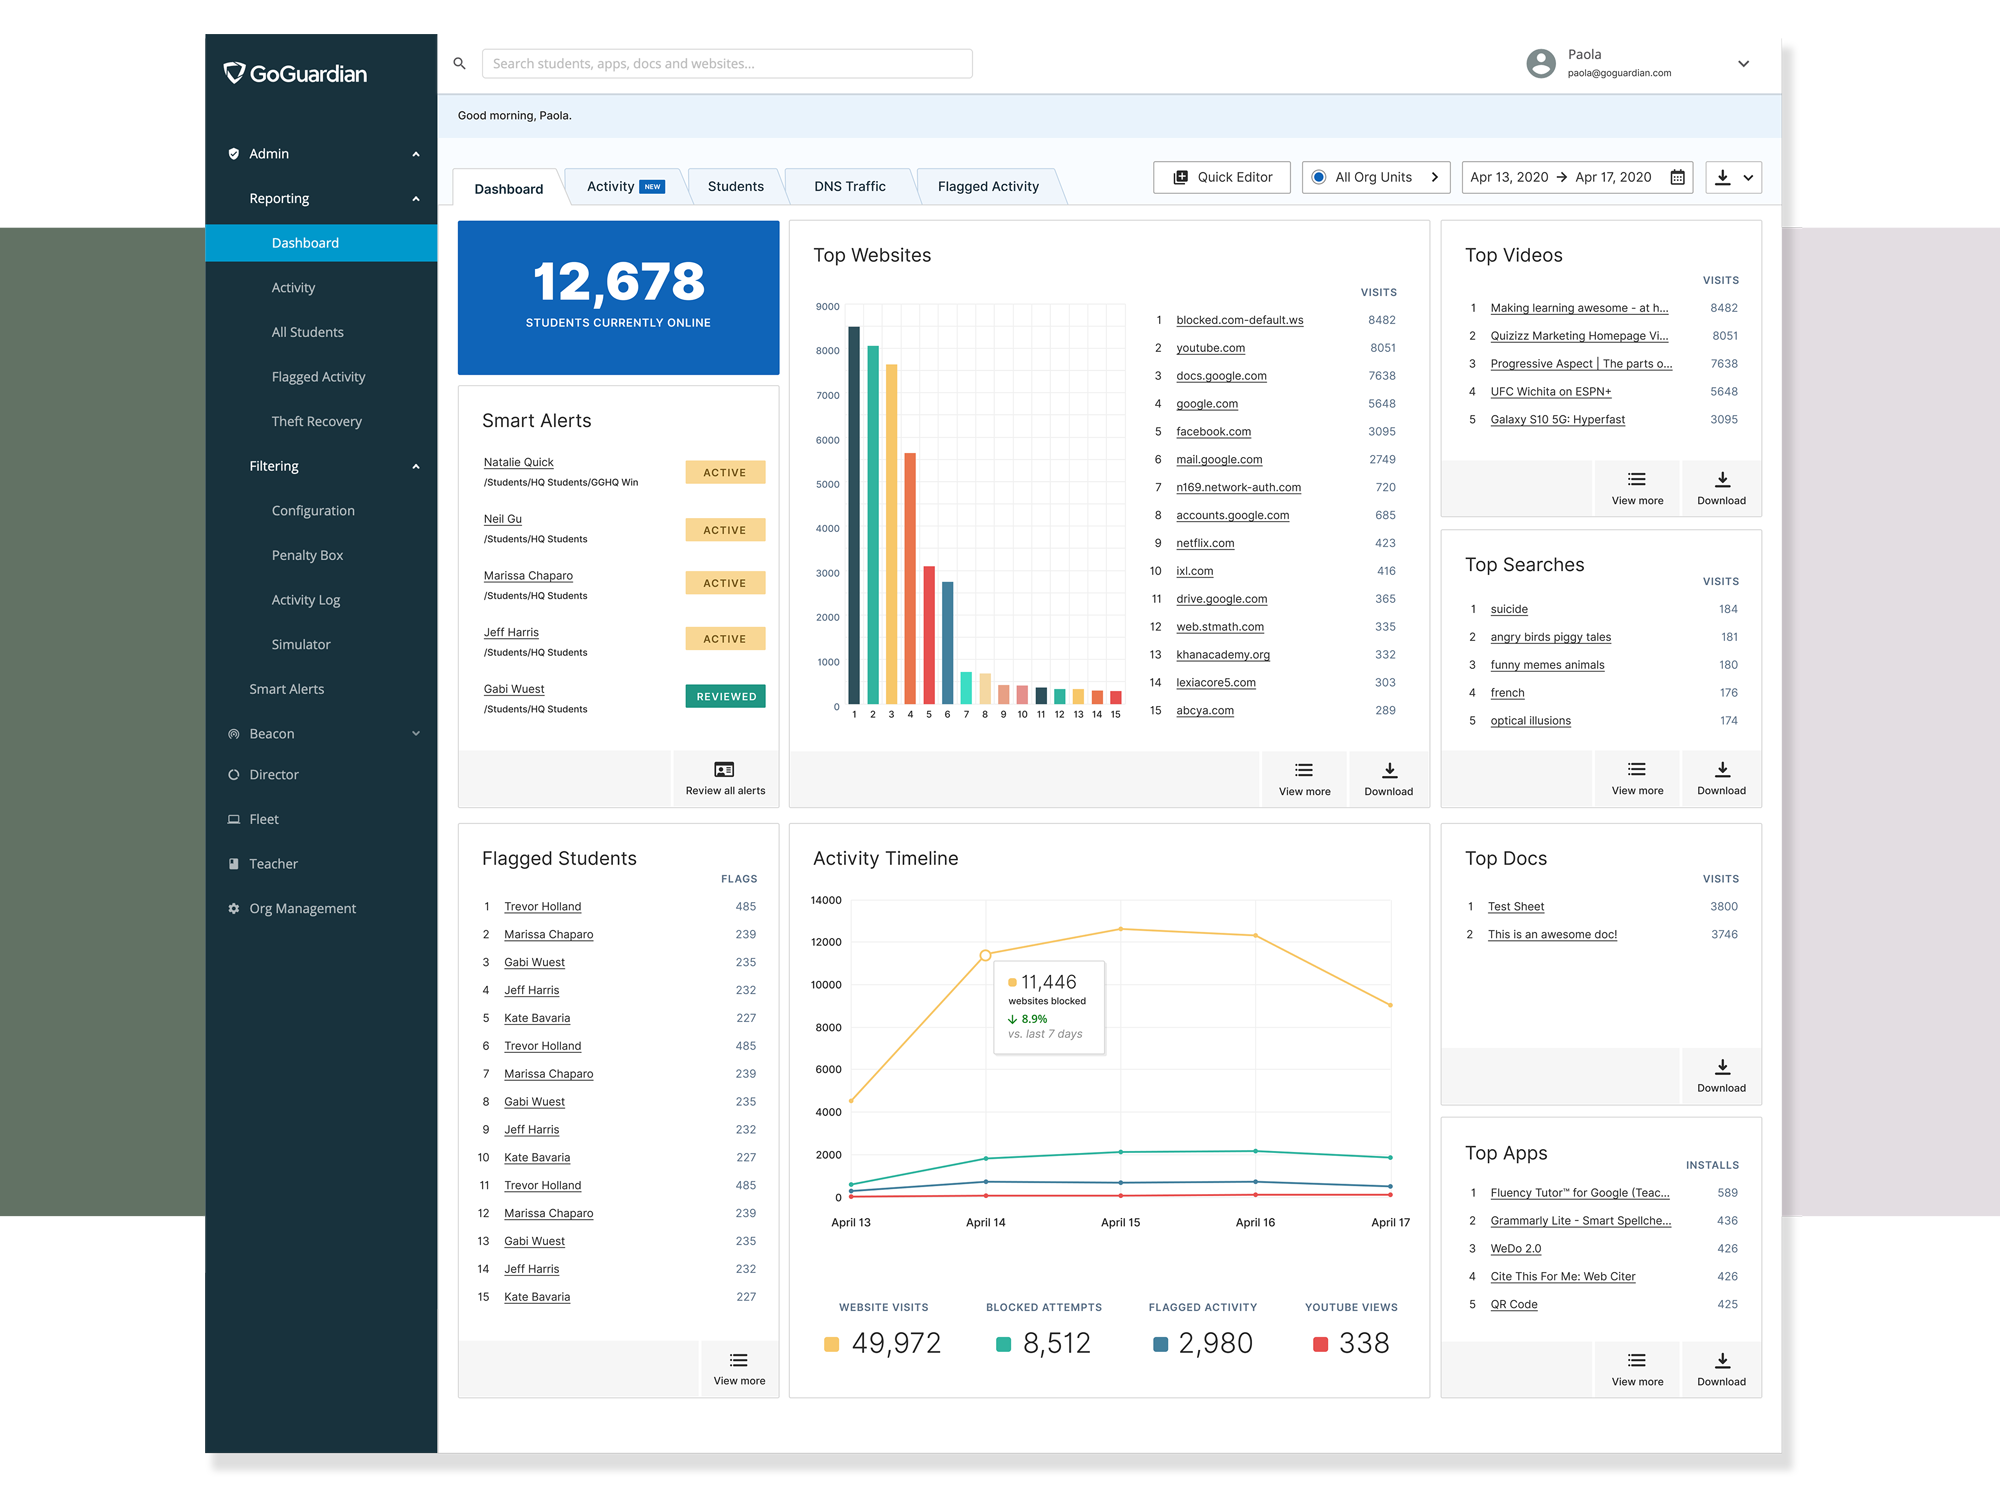
We initially set out to iteratively enhance the experience because of the level data density within the dashboard alone.
However, during usability testing we discovered that our users were more than ready for a bigger change and we sought to fill that need. Our strategy then was to be able to provide more insightful data visualizations without the need to translate the data. Users should be able to manipulate, download, and edit their own data as needed.
Role: Lead UX designer
Timeline: 1 month
Requirements: Discovery research, design strategy, interaction design, data visualizations, usability testing, prototype.
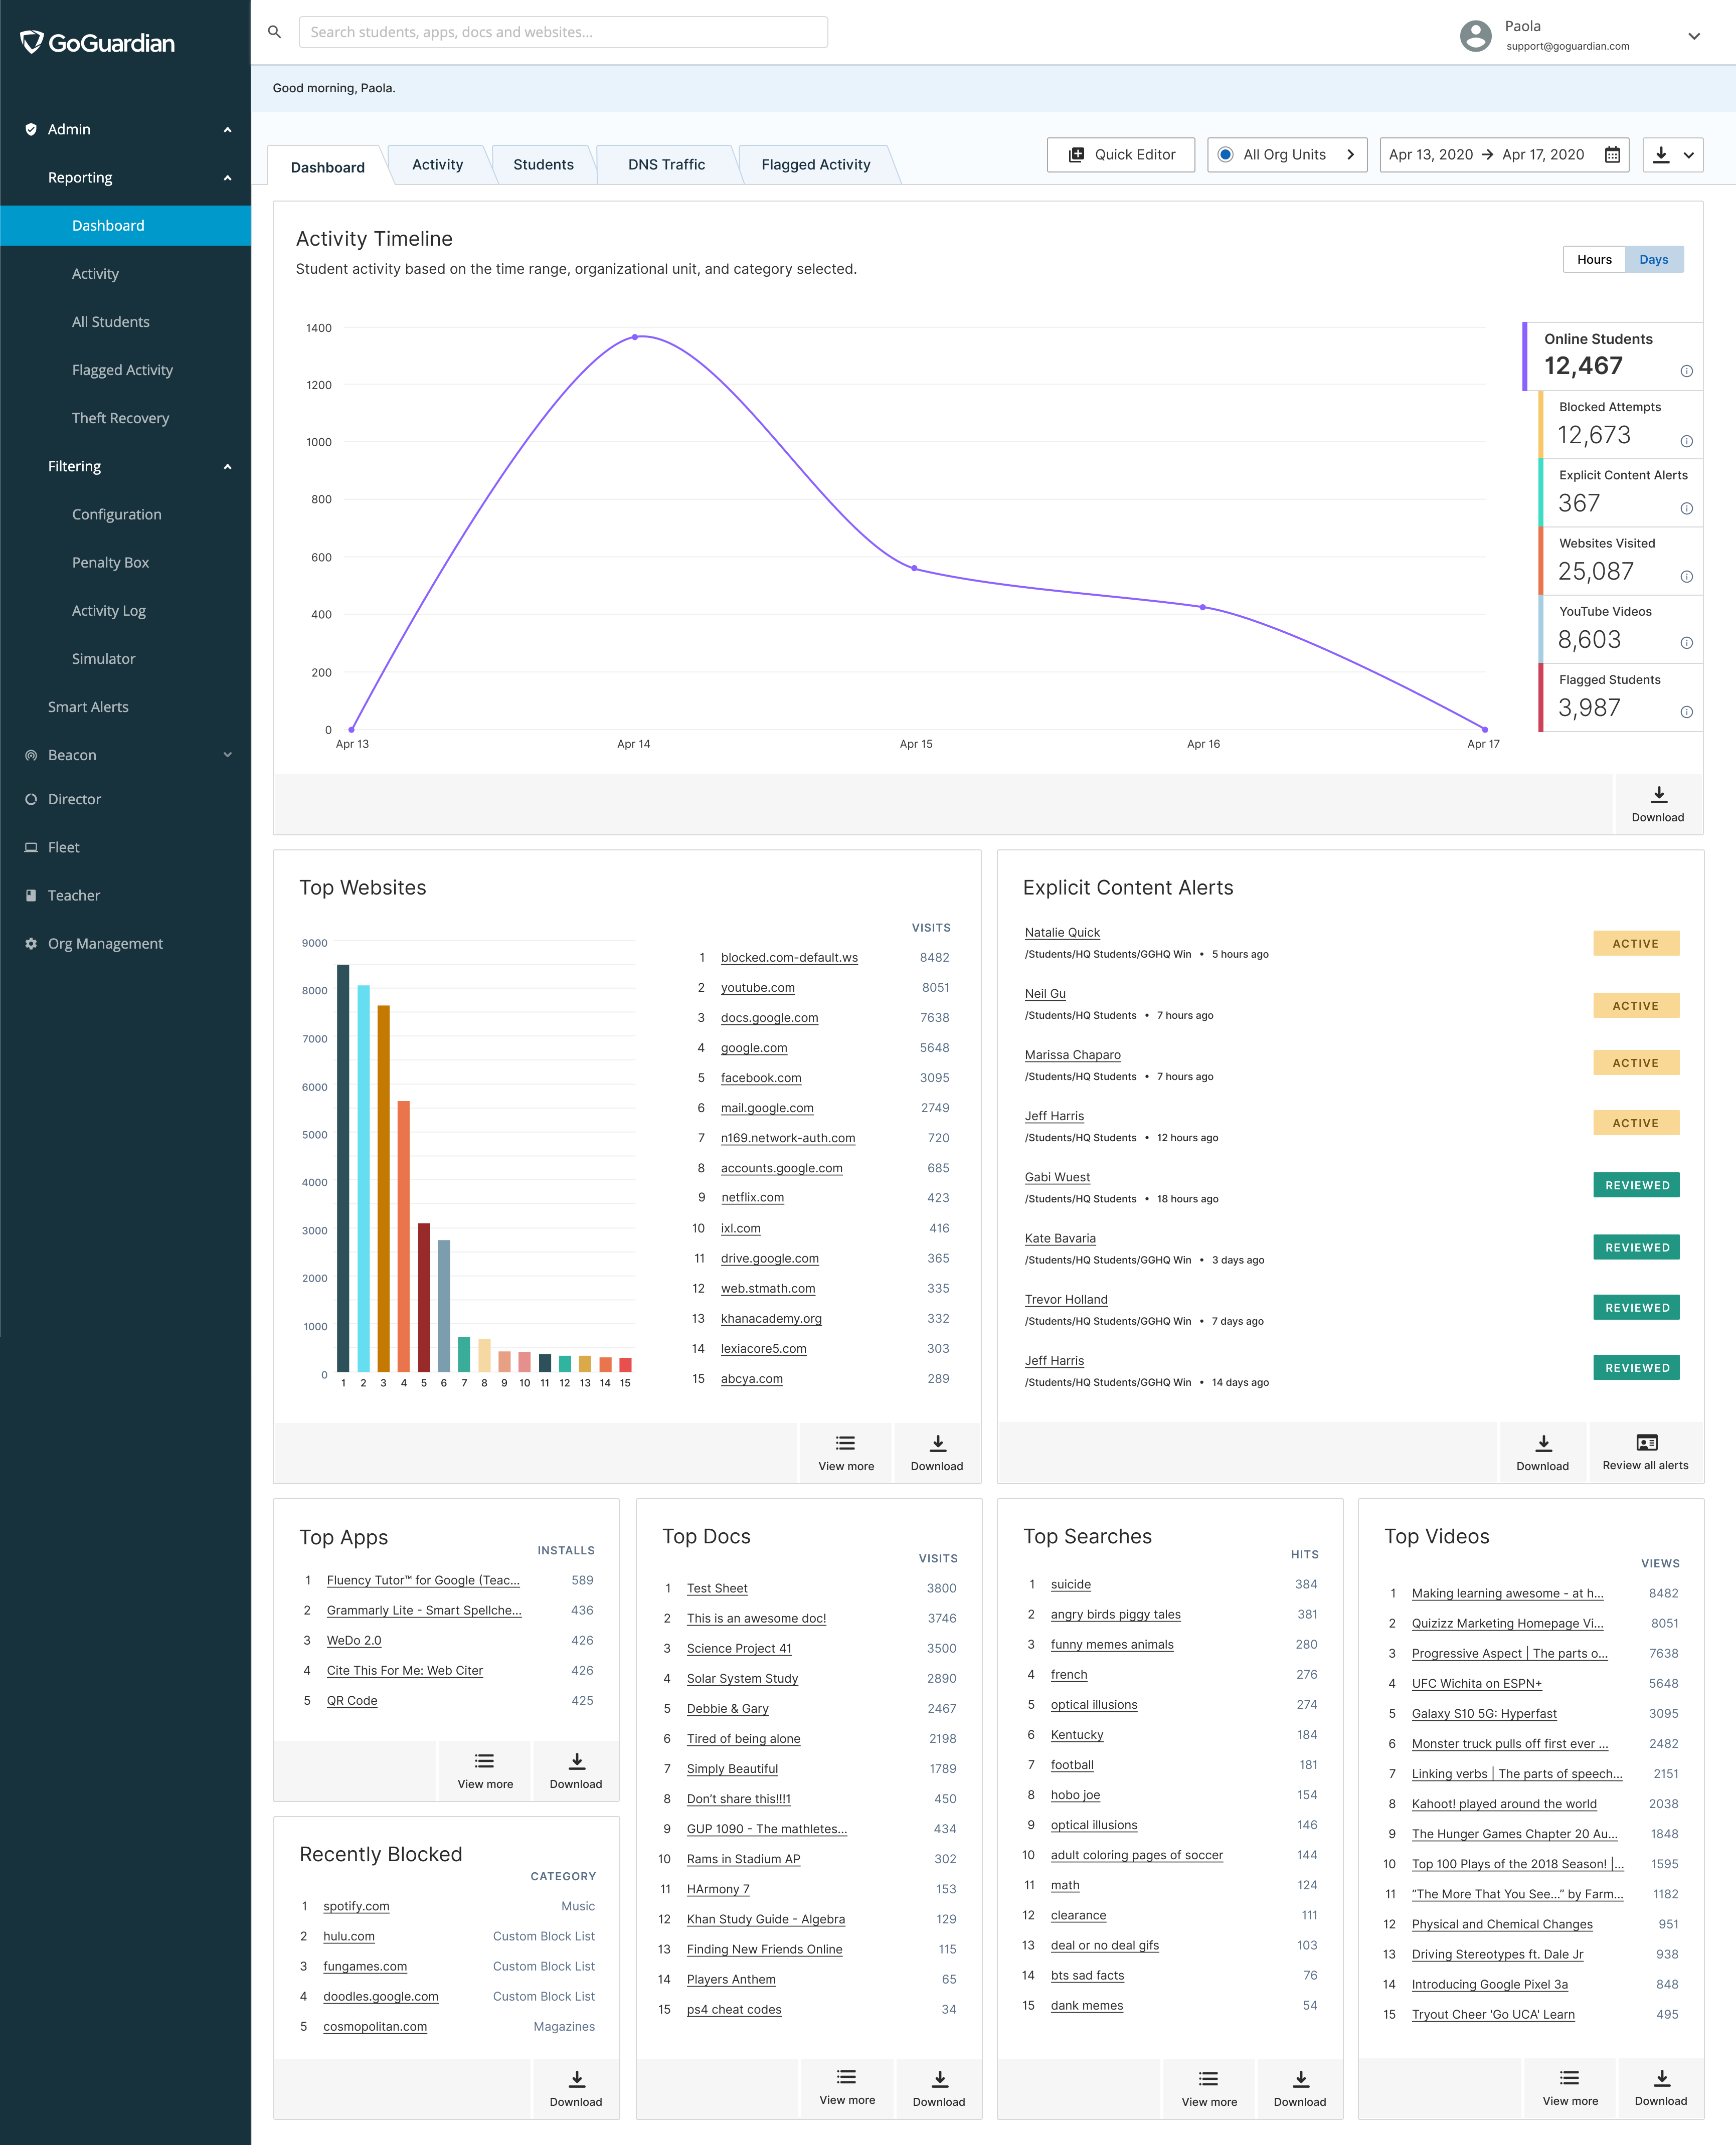
Displaying trends over time
A natural progression of the data we were displaying was to layer it over another element. Layering content type and size over time allowed our users to analyze possible trends and easily highlighted unusual spikes.
Better data consumption and control
Users had no way of directly downloading reports or controlling the data they saw on their dashboard. We added sitewide patterns allowing users to download any singular report or a summary of their entire dashboard.
Integration between features
Another interaction we weren't exactly making easy for our users was connecting our reporting and monitoring features. Users typically diagnose with reporting and problem solve with monitoring.
In this example we've added product-wide support for adding any URL that appears in a report directly to a monitoring feature with a single click.
This project continued after my time with GoGuardian ended.